In an ever increasingly competitive market, it is critical that agencies and their owners make the best decisions possible to continue heading towards their vision and achieve financial success.
Data should be a key component in your decision making as it can help increase your understanding of your agency, how profitable your clients actually are, and ultimately drive your profitability.
Why should you care about your data?
It is easy to overlook your own data as you focus all your time and energy on delivering exceptional outcomes for your clients. Through using data effectively you can ultimately drive improved profitability, this can be done in many different ways;
- Greater insight – The more data you have access to, the more you can understand the performance and trends of your agency. Once you know how your agency is performing you can start to ask the simplest of questions – Why?
- Better decision making – If you know what is happening in your agency and also why, you are able to make much more informed decisions.
- Improved operations – With better decision making comes more improved outcomes, performance and operational efficiencies. You can also measure the change in your agency and quantify the benefit created.
- Informed strategy – A clear and holistic view of your agency’s performance should feed into your strategy and challenge you to think how do you improve your agency as a whole? What are the key issues facing us and where are the opportunities for us to grow?
Why time tracking is your most important data
For most agencies, people and time are your products and unless you understand and make effective use of them, you may never be able to fulfil your potential.
Through a statement of work you know what has been sold to a client, but without time tracking you don’t know how much effort has been put into its delivery. It’s like a retailer selling you a bottle of wine but not knowing how many bottles you have taken out of the store!
Our Time Tracking Template should be a great way to accelerate your understanding and insight into your team’s time.
However, time tracking shouldn’t just be about collecting time sheets from your team, you need to be thinking about how you can report on time data but more importantly use the data to drive real change for your agency:
- Improve your statements of work – making them more reflective of how long things actually take
- Improve your project delivery – getting full visibility for you and your team about progress, blockers and issues
- Improved resource management – creating visibility of bottlenecks and spare capacity and maximising your teams utilisation rates
- Understanding client performance – make sure the juice is worth the squeeze by analysing the time you spend on client work versus the amount you get paid
- Forecasting and planning for the future – understand your current potential revenue capacity and plan for future recruitment and strategic initiatives with our Revenue Capacity Template.
Understanding client and service profitability
Understanding client and service profitability is one of the biggest challenges for an agency and whilst clients should not be judged solely on profitability, at the very least you want to know whether a client is adding some profit to your agency.
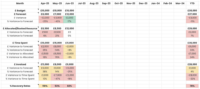
Before you start looking at client profitability, it’s always a good start to put in place financial budgets and forecasts for your clients to get you thinking in advance about how much revenue and value they might bring to you.
There are three main data points that will flow through your analysis and help you understand client profitability;
- Role – What role is being sold to the client
- Rate card – How much revenue do I generate for each role per day
- Effort – How many days effort has either been sold or worked
Once you have access to this information, you are simply trying to knit together lots of different data sources;
- Statements of work – What has actually been sold to a client
- Resource allocation – How much time has been allocated to statement of work
- Time spent – How much time has been spent delivering a statement of work
- Invoices sent – How much has actually been invoiced for delivering a statement of work
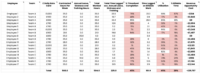
With this information you will be able to calculate something called Recovery Rate.
Recovery Rate
Recovery rate is the single most important metric for understanding client profitability. It highlights the percentage of time that you spend on a piece of work that you successfully bill for.
It is calculated by looking at £ Total Time Spent / £ Total Invoiced Value.
When you know your recovery rate, you can start to understand how profitable a client is to you, but also start to think about how you can improve that profitability both for a client, a service or your entire agency.
- Recovery rates above 80% means you are likely generating net profit
- Recovery rates between 60% and 80% means you are likely generating gross profit
- Recovery rates below 60% means you are likely losing money
To help, we have created a Client Profitability Template for how we would recommend tracking and reporting on your team’s time.
Create the right measures to understand your agency’s performance
It is important that you use data to get a holistic understanding of how your agency is performing to help keep people informed, create accountability and drive performance.
Too often you are reliant on financial metrics to tell us how your agency is performing and whilst that is a critical metric, there is huge value in understanding how your agency is performing at an operational and strategic level.
Whilst it can be daunting to start collecting data and reporting on these operational and strategic metrics, when you start you will realise the huge value it creates and how using data effectively can give you the best chance of achieving your short term revenue targets and mid-to-long term objectives.
Strategic metrics
At a strategic level, we would always recommend trying to create metrics that help drive and support your vision. This can be done by thinking about how your vision cascades down into your strategy, objectives and key results (OKRs) .
An example would be;
We would always recommend using a Balanced Scorecard report to help visualise your strategy and progress against your vision. It’s a great tool for using in board meetings as well as sharing with your teams to show progress and areas of concern. To help get you started, we have created a Balanced Scorecard Template.
Operational metrics
At an operational level you are really trying to understand the key metrics that best describe how your agency is performing on a day-to-day basis.
Whilst some of these metrics might be finance related, such as your revenue forecast or invoices sent this month, you are likely to want to look at metrics that relate to your people and processes.
You should think about metrics that highlight what has happened in the past, what are you currently experiencing as well as thinking about future facing metrics to help inform the future.
All agencies are different, but the important thing is to create the right metrics for you and ensure you have the right rigours and processes in place to interrogate what the metrics are telling you and drive quick change.
So what should I do now?
If you want to get more out of your data and help grow your agency, it’s good to take things slowly. Think about the one or two things that you want to improve, either at a strategic or operational level, start collecting your data and start asking your team questions.
If you can create an environment where the whole team understands that numbers are good as they help you understand performance, generate insight and drive change then you are halfway there.
You don’t always need to be on the lookout for huge wins, sometimes it’s a case of finding things that can make that 1% improvement to your agency. A few of those every year and you will quickly start to reap the benefits.
Tom Fitzgibbons has spent his career in digital, retail, publishing, marketing and IT roles. He spent 6 years as an Agency Managing Director, where he scaled operations from 30 to 90 people, operating in 3 countries and increasing revenues by 2.5x.
He founded cady in 2023 and is focussed on supporting agencies to develop and achieve their potential.
See Tom’s LinkedIn profile and get in touch with him here.